Anyone who has ever done a linear regression in R has seen an R formula. R formulae are examples of the Wilkinson notation, sometimes called the Wilkinson-Rogers notation. This same notation is used by other applications including Matlab and Octave to indicate relationships between variables. In most cases, R users have seen the Wilkinson notation being used to describe a purely linear relationship such as
model<-lm(formula = sales ~ TV + radio + newspaper, data = advertising)
It is simply a fact of existence that linear math is the easiest but the universe is nonlinear. Fortunately, for many tasks in R we can make use of the fact that while some variable y may not be linear in x, it may be linear in some function of x. R's formula notation makes this easy to express.
model<-lm(formula = y ~ I(f(x)), data=df)
The function f(x) might be as simple as x2. We could easily build a linear model in x2 as follows:
model<-lm(formula = y ~ I(x * x), data=df)
Similarly, we could build a model linear in log(x), but only if we are certain that x will always be greater than zero.
model<-lm(formula = y ~ I(log(x)), data=df)
There is a built-in function poly( ) that can also be used in R formulae, but not without some sacrifices.
model<-lm(formula = y ~ poly(x,degree=2), data=df) # or just poly(x,2)
Notice that this is not the same as using I(x*x). I(x*x) specifies a relationship with x2, while poly(x,2) specifies a relationship with x2 + bx. In more advanced techniques, you may wish to use a series of orthogonal polynomials in a model, but we shall not discuss such matters here. When building basic models, using a power of x greater than two we run a very high risk of overfitting our results. In the words of John von Neumann "With four parameters I can fit an elephant, and with five I can make him wiggle his trunk."
The predict( ) function works with models created using I( ) and poly( ) just as it does with other models. Unfortunately, there seems to be no direct access to the generated model, and it seems like we must be satisfied with what predict( ) gives us.
Formulae in Graphs
While R formulae are of critical importance in model building, they can also be used in graphics where they provide a nice convenience. For example, the notorious mtcars dataset provides mileage data (not "kilometerage" data) in English units. When the time comes to plot our findings, we can easily convert units right in the plot function using a formula.
plot(mtcars$hp ~ I(mtcars$mpg * 0.425 )
,xlab="kilometers per liter", ylab="horsepower")
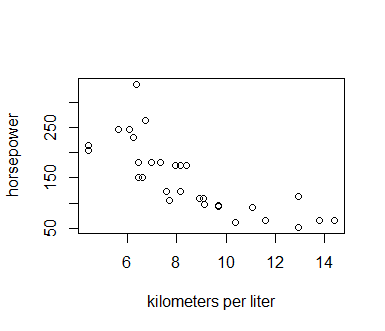
I'll let you worry about converting Imperial horsepower to metric horsepower, or watts, or whatever.
Conclusion
Making greater use of Wilkinson notation can improve the performance of linear models and, in the case of graphics, simply make life a little easier.
Related Training: