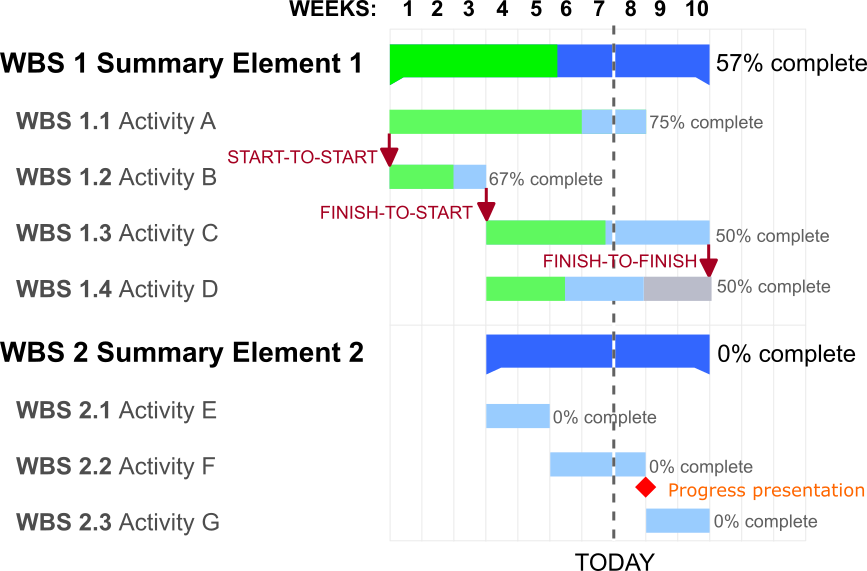
In the first part of this Introduction, I talked about some of the basic use of a Gantt chart and some of the essential features. I will expand on both of those in this post. To help make that easier, I have edited the Gantt chart from last time. (It is a Public Domain image as shown in the link below.)
Notably, I have changed the colors a bit so we can see some flexible or slack time in the completion in WBS 1.4. I also added a milestone at the end of week 8 / beginning of week 9.
What is slack time?
In any project, some tasks need to be completed by a specified time. Here, WBS 1.4 needs to be completed at the same time as WBS 1.3. It does not take as long as WBS 1.3 and is planned to start at the same time. That means the completion time is flexible: it could be completed as early as the end of week 8, or as late as the end of week 10. Based on the chart, it does not depend on anything to set its start time.
It can be difficult to decide when to start a task with slack time. That is not really a big deal here. The point is, that WBS 1.3 and WBS 1.4 need to be done at the same time.
What is a milestone?
Milestones are zero-duration items in the chart that show dates of important events. Here we have a progress presentation of some sort that is likely to show a major lack of progress! Milestones may reflect payments, meetings, demonstrations, or other events for the project. These are almost always "hard" dates that are difficult or impossible to change. In one project on which I worked, a milestone was a particular type of physical testing for a satellite payload. Missing that test could have delayed the launch or, more likely, prevented the payload from being carried on the satellite!
Milestones can also help teams plan other tasks. If some tasks need to be completed before a milestone, they would likely be part of a summary task ending at the time of the milestone.
How long does it take to finish?
In our example Summary Element 1 takes ten weeks to complete. We know that not just from the fact that it is drawn that way, but because WBS 1.2 starts at the beginning of the project (at the same time as WBS 1.1, WBS 1.3 cannot start until WBS 1.2 is completed, and WBS 1.2 takes three weeks and WBS 1.3 takes seven weeks. Since 7+3 = 10, that is our duration. The discovery of these limits is called critical path analysis. Some Gantt chart tools highlight a critical path in a different color than other tasks, often in red.
Do colors matter?
If you saw the chart in the first part of this discussion, you'd note that it used different colors. That was OK, but the need for a color to show the slack time caused me to re-color this chart. Different people and organizations set different rules for color use: one might require that activities performed by a particular team be in a particular color, for example. Personally, I like to use green for completed parts of tasks, and grey for flexible time. The green for "completed" makes it easy for me to see at a glance what is finished. I like red for critical paths and the arrows to show relationships as in this chart. I particularly like the dashed line used for "TODAY" in this chart.
What tools should I use?
When Henry Gantt described these charts around the turn of the 20th century, the charts were hand-drawn. Now virtually every project management software tool has a Gantt chart feature. Both Microsoft Project and OpenProject (the popular open source project management tool with many features in common with Microsoft Project) have Gantt chart capabilities, for example. There are also tools to make Gantt charts in Microsoft Excel, OpenOffice / LibreOffice Calc, and Google Sheets along with myriad standalone tools.
Gantt charts are one way to visualize and plan project completion. Timelines and PERT charts are two common alternatives. Gantt charts, however, have stood the test of time as a way to quickly visualize the completion and structure of projects.[:]