In this article, I will look at two helpful planning techniques: Gantt Charts and Burndown Charts. Both have their pluses and minuses. Gantt Charts were named after Henry Gantt, who invented them early in the twentieth century. Burndown Charts are often used in agile environments to track the progress of projects.
Optimizing Project Management with Gantt Charts and Burndown Charts
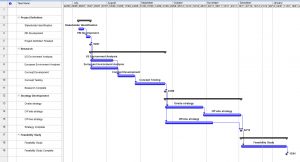
Gantt Charts are a graphical way of depicting what work needs to be done on a project. They show the tasks to be done, the ordering of the tasks, their start and end dates and which resources are assigned to do each task. An example of a Gantt Chart is shown in figure 1.
(click image to enlarge)
Most project managers use planning software to create Gantt Charts. The most popular planning software is Microsoft Project. Planning software makes it quick and easy to create the charts, change the diagram format to highlight different aspects of a plan, and update a plan as a project progresses.
On large projects, Gantt Charts can become quite complex, so software like Microsoft Project can quickly work out the knock-on effect of changing one aspect of the plan, such as delaying the start of one task or reducing the number of resources, on another aspect of the plan such as the end date of the project.
Another helpful feature of a Gantt Chart is adding milestones to show when significant points in the project have been reached. These are usually represented as black diamonds; you can see some examples in figure 1.
In my projects, I find it helpful to print out a large copy of the Gantt chart each week and hang it up in the project room during team meetings. This helps the team discuss how they will work together and helps them see the interdependencies between all their tasks.
Project managers sometimes create Gantt Charts with too much detail too far ahead in the future. This is unrealistic, as these detailed forecasts are likely to be inaccurate. In addition, it will lead to overly complicated diagrams, which are time-consuming to update and maintain. At the other extreme, some project teams create Gantt Charts, which are too broad.
While these sorts of charts are quick to create and update, they need to provide more detail to help project teams plan and coordinate their work. A balance between these two extremes is the best way of using Gantt Charts.
Agile Project Management: Burndown Charts, Velocity, and Forecasting
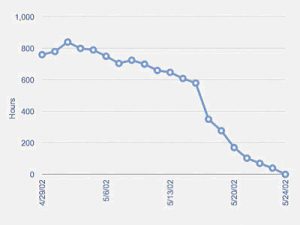
Some project managers need help with Gantt Charts. If that is the case, they might use the Burndown Chart format instead. Burndown Charts are widely used in agile projects. They do not show the relationship between all the tasks and who's doing what and when. However, they clearly show how much work remains to complete the project and how this estimate changes over time. Figure 2 shows an example of a Burndown Chart.
(click image to enlarge)
To put one together is very simple. First, the project manager regularly, maybe every day, asks each team member how much work they estimate remains for the tasks they have been given. Then, the project manager totals these figures and plots them on the Burndown Chart. After several plots on the chart, the project manager can estimate a trend line.
By drawing such a trend line onto the chart and seeing where it cuts the horizontal axis, the project manager can estimate the likely end date of the project. Like Gantt Charts, project managers often use planning software to create and update Burndown Charts. Jira is a top-rated work-tracking tool that creates these charts.
This trend line is known as the Burndown Chart's velocity. Not only can the velocity be used to predict the project's end date, but it also shows the capacity of the team to do work. The gradient of the line shows the team's productive hours per day. Once a project has been completed, and this capacity is known, it can be used to estimate more accurately how long it will take to do future projects.
The Burndown Chart quickly communicates an aggregate figure of where the team is in the project. Also, it shows how accurate the team is at estimating. If the project manager regularly sees up slopes in the chart, they know the team needs to improve their forecasting.
Finding the Right Planning Tool
Burndown Charts are simple to use; however, unlike the Gantt Charts, they do not help a team understand the interdependencies between tasks and the knock-on effect caused by delaying one task will have on another task. Based on this, the best approach is to use both charts. First, the Gantt Chart can be used to create the initial project plan to understand dependencies and work ordering. Then, the Burndown Chart can track the work throughout the project.
FAQ for Battle of the Planning Tools: Gantt Charts versus Burndown Charts:
What are Gantt Charts and Burndown Charts used for?
Gantt Charts and Burndown Charts are both helpful planning techniques used for project management. Gantt Charts show the tasks to be done, the ordering of the tasks, their start and end dates, and the resources assigned to each task, while Burndown Charts show how much work remains to complete the project and how this estimate changes over time.
What is the difference between Gantt Charts and Burndown Charts in task management?
Gantt Charts help project teams plan and coordinate their work by showing the interdependencies between all their tasks and the knock-on effect caused by delaying one task on another task. Burndown Charts, on the other hand, are simple to use and show the remaining amount of work to complete the project.
What is a Kanban board, and how is it related to agile projects?
Kanban boards are visual tools used to manage work in progress and help teams prioritize their tasks. Kanban boards are closely related to agile projects because they promote continuous delivery and help agile teams remain flexible to change.
What are some Microsoft Project alternatives for creating project schedules?
Some popular alternatives to Microsoft Project for creating project schedules are Jira, Asana, Trello, and Wrike. These are all cloud-based tools that offer team collaboration and work management features.
How can I create a Gantt chart?
There are many tools available to create Gantt charts, such as Microsoft Project, Excel, or cloud-based software like Asana or Trello. Simply input your project tasks and their start and end dates to create your Gantt chart.
How do Scrum teams use story points in project management?
Scrum teams use story points as a measure of the effort required to complete a task. They help teams estimate the complexity and workload of a task, and allow teams to forecast how much work they can complete in a given sprint.
What is the ideal work remaining line in Burndown Charts?
The ideal work remaining line in Burndown Charts is a straight line connecting the work remaining on the first day of the project to zero work remaining on the final day of the project. It is used to track progress and compare actual progress to the expected progress of the project.
What is the role of a project manager?
A project manager is responsible for planning, executing, and closing projects. They oversee all aspects of a project, including developing project schedules, managing budgets, allocating resources, and ensuring that project goals are met.
How are start and end dates represented in Gantt Charts?
Start and end dates are represented in Gantt Charts as horizontal bars that indicate the duration of a project task. The length of the bar represents the length of time the task is expected to take.
What is the vertical axis on a Burndown Chart?
The vertical axis on a Burndown Chart represents the amount of work remaining to complete the project. It is measured in units of work, such as hours, story points, or other relevant units of measurement.
What is a risk burndown chart?
A risk burndown chart is a visual tool that shows the number of risks remaining in a project over time. It is used to monitor and manage risks in a project, and can help project managers identify potential risks and take steps to mitigate them.
What is the role of a project manager in using Gantt Charts and Burndown Charts?
The role of a project manager in using Gantt Charts and Burndown Charts is to create and update the charts, track the progress of the project, estimate project completion dates, and identify any issues or risks that may impact the project.
What are some project management skills to develop for a career in project management?
Some essential project management skills include communication, organization, leadership, time management, and risk management. These skills can be developed through education, training, and practical experience.
How can I pursue a career in project management?
To pursue a career in project management, you can start by gaining project management skills and experience, obtaining relevant certifications, and networking with professionals in the field. You can also consider pursuing a degree in project management or a related field.
This piece was originally posted on Nov 26, 2019, and has been reposted with an updated title, headers, links, and FAQ