Like many others, I wrote my first DAX measures in Excel Power Pivot. It seemed so natural to add measures in the editing area associated with the fact table I never considered any other way. But while measures specify one or more tables in their code definition, there is really no restriction on "where" they may be defined. We can use this fact to make measures easy to find and use in the Power BI desktop environment.
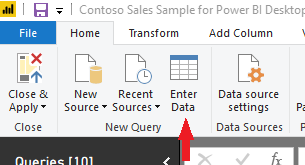
We start by creating a table that is destined not to hold any row data at all. In this example, I will bring up Power Query and choose "Edit Data" from the menu.
I'll type in any value and name the table SalesMeasures. After applying the changes and returning to the Power BI desktop, as few or as many measures as we wish can be added to this new "table".

For this example, I'll create two measures, MedianSalesAmount and 90th Percentile SalesAmount.
90th Percentile Sales Amount = PERCENTILE.EXC(Sales[SalesAmount], 0.90)
MedianSalesAMount = MEDIAN(Sales[SalesAmount])
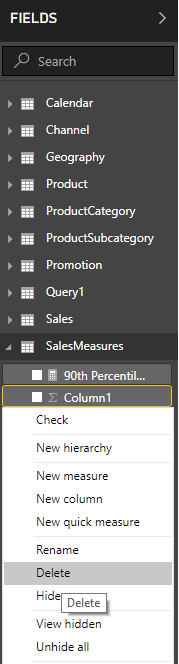
Now that we have some measures, we really don't need any rows or columns in the table at all. We can delete "Column1" from the SalesMeasures table. Note that at present the SalesMeasures table is in the "S" section of the fields list, and the icon is like that of any other table.
We can now save our work, then close and reopen the Power BI workbook.
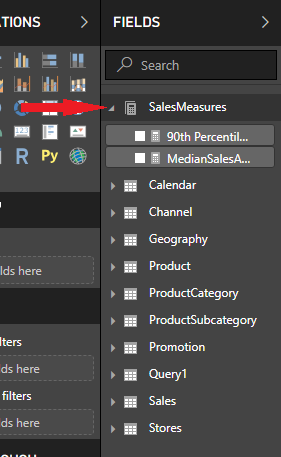
When we reopen the workbook, we note that because there is no row data, the SalesMeasures table has moved to the top of the fields list and the "table" icon has been replaced with the measure icon. Users no longer have to search for particular measures; they're all together at the top of the tables list.